![]()
![]()
![]()
![]()
![]()
![]()
![]()
![]()
![]()
![]()
![]()
![]()
![]()
![]()
Site and all content
Copyright © Ashley Africa
historical Climate Data |
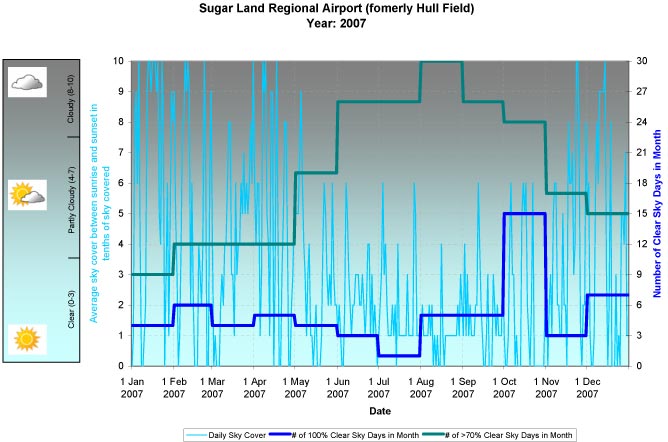
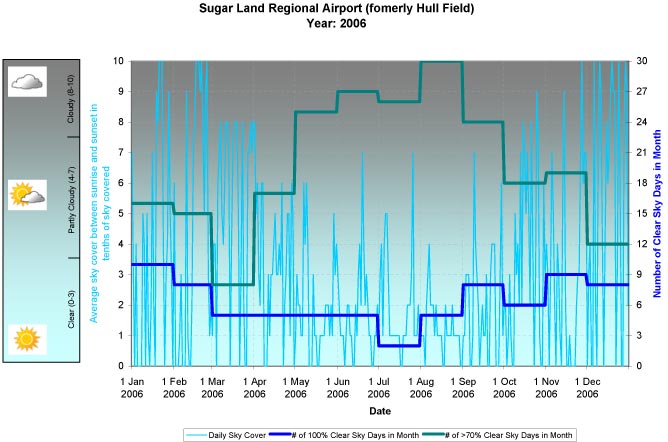
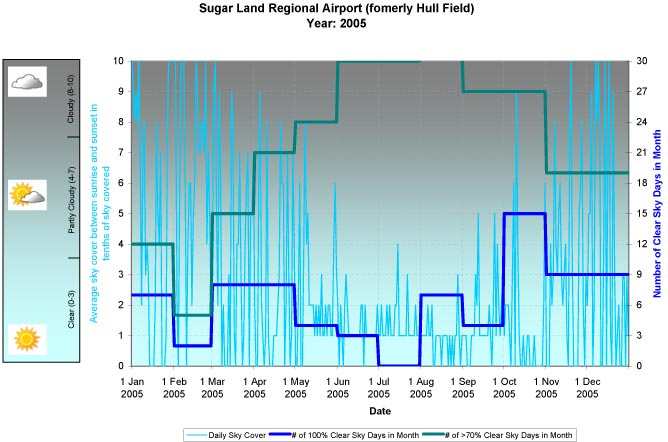
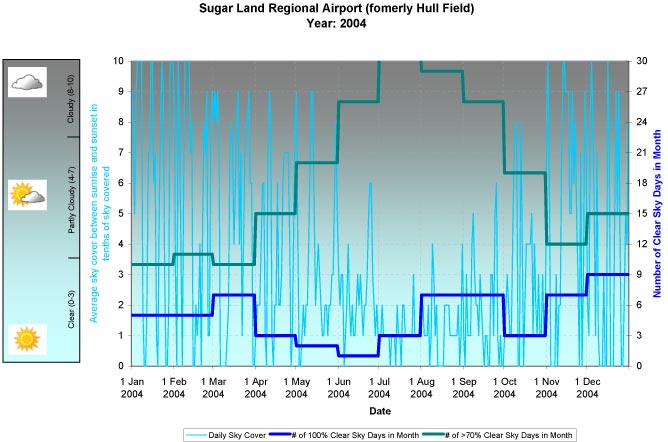
This data analysis was initially spurred on by comments made by fellow astronomers that 2007 had been one of the worst years for observing. Setting personal biases aside, here is an analysis of some measured data ...
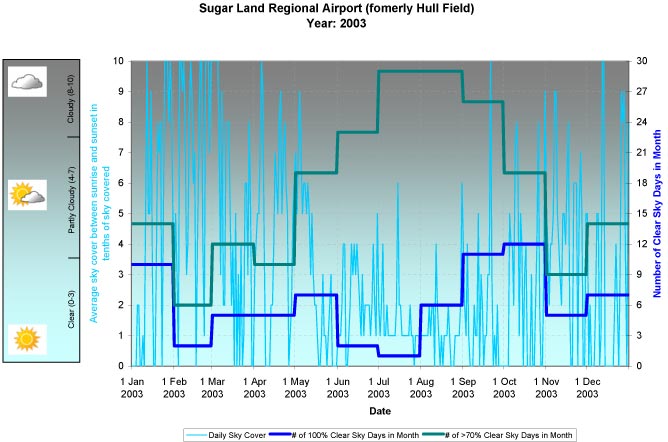
The page contains graphical representations of data derived from the NOAA's National Weather Services Local Climatological Data (WS Form: F-6) for the Sugar Land Regional Airport (formerly Hull Field) located in north central Fort Bend County (29 37 N, 95 39 W).
A few things that became clear to me after looking at the data:
- although cooler months (October through January) have on average fewer clear sky days (less than 30% cloud cover) than the rest of the year, they have more 100% clear sky days
- warmer months (June through September) have a lot of clear sky days, but a persistent 10% to 30% cloud cover is common over this period
These observations are based on daytime data only, changes between daytime and nighttime due to temperature fluctuation because of proximity to the Gulf of Mexico has not been factored in ... I'll be using the summer months of 2008 as a test year.
summary Cloud Cover Statistics
Yearly Summary of Number of 100% Clear Sky Days
|
|
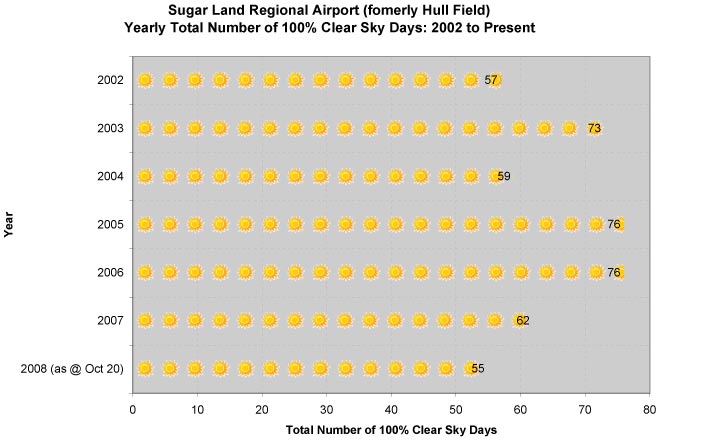
last updated October 20, 2008
Monthly Summary of Number of 100% Clear Sky Days
|
|
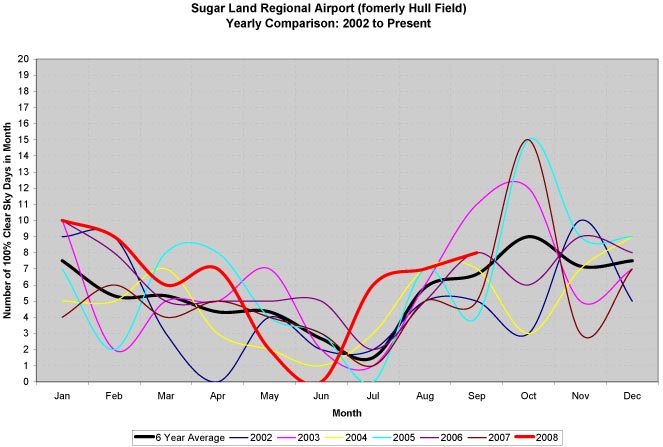
last updated October 20, 2008
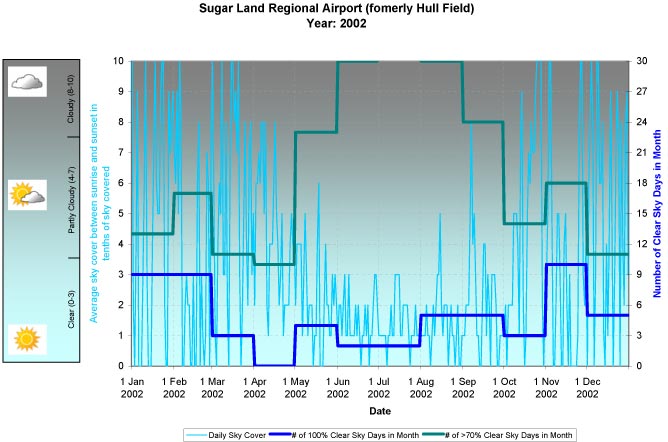
daily Cloud Cover
Data plotted below is described as the average sky cover between sunrise and sunset in tenths of sky covered. The minimum of "0" means no clouds observed, "10" means clouds covered the entire sky for that day.
2008
|
|
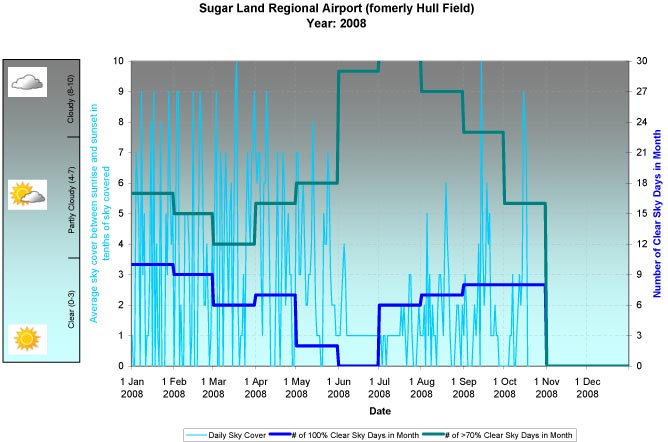
last updated October 20, 2008
2007
|
|
2006
|
|
2005
|
|
2004
|
|
2003
|
|
2002
|
|